The platform is a complex, scalable cloud-based solution. The data of the organizations are completely separated, so they can be fully exported or deleted from the database without affecting other systems.
Each organization has a web application (workspace) where user functions and the associated database are located.
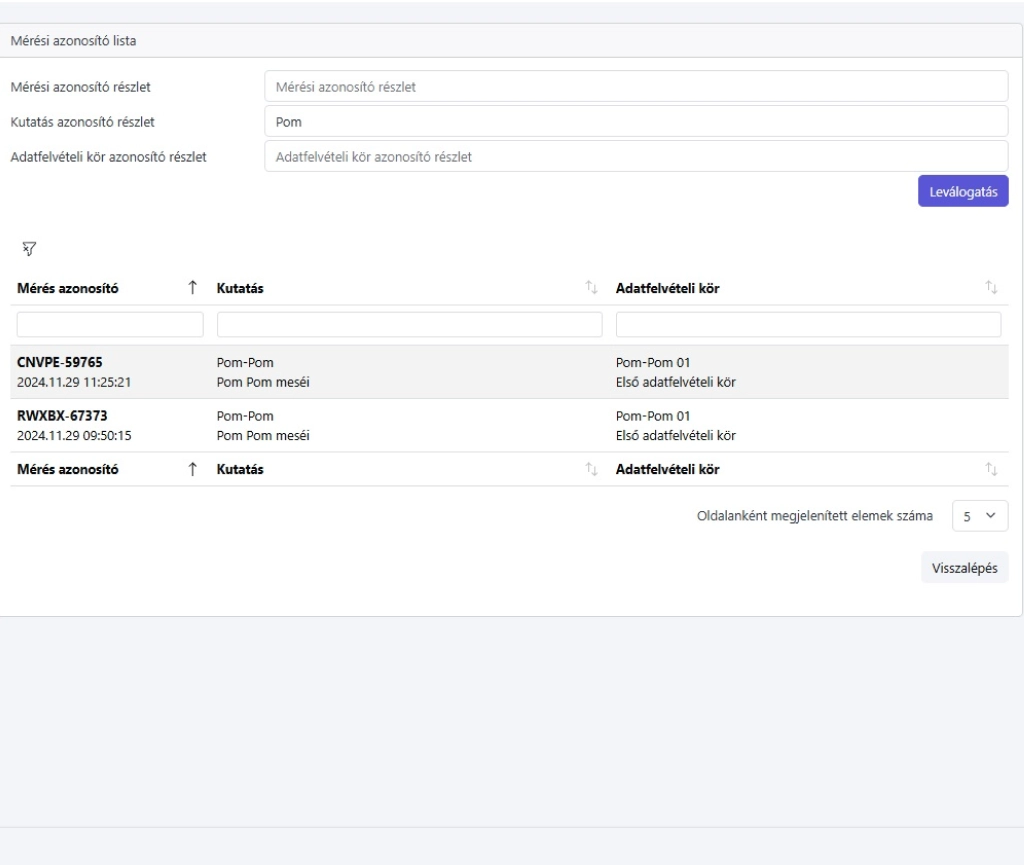
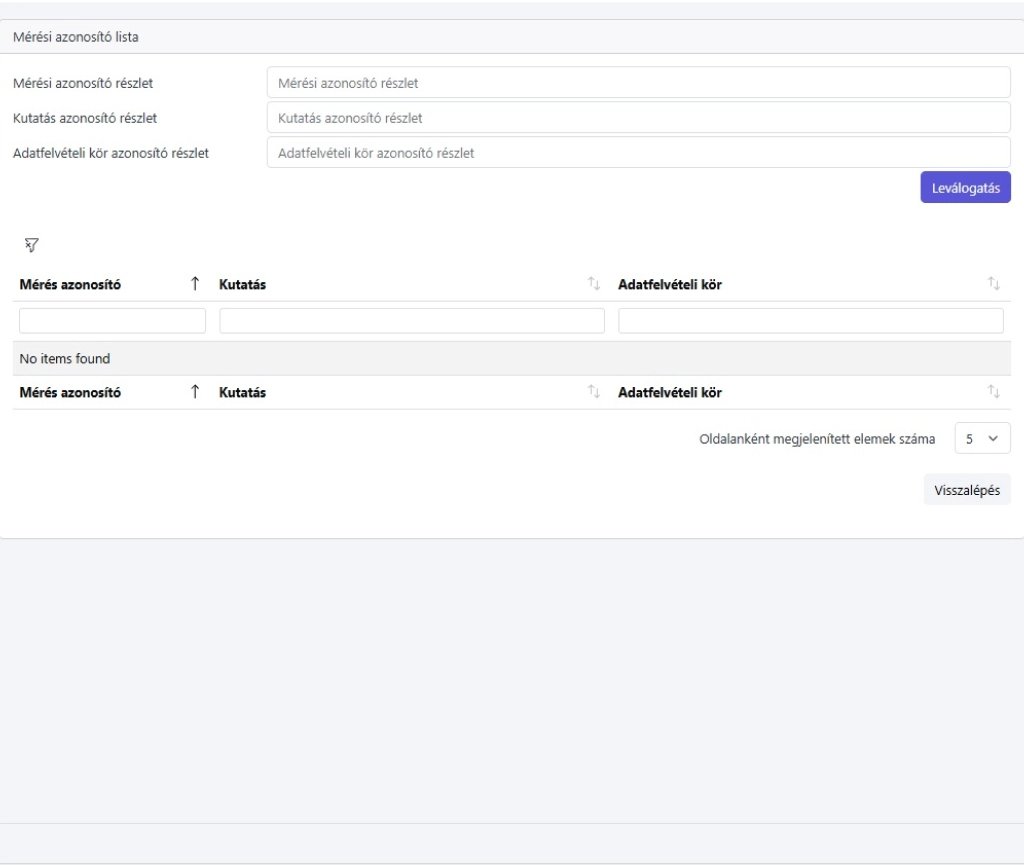
The system stores measured data in separate schemas, which allows for scaling across multiple hardware and parallel execution of queries due to the distributed database system.
The TR4U Platform consists of several cooperating modules:
Organizational and research administration
Virtual reality tasks
Questionnaire
EnergoWatch mobile application (Android) and smart bracelet
Ticketing module
Replay and tagging
AI emotion analysis
Dashboard, file, and automated processing management
Data space, storage for measurement data
Each module provides internal and external programming interfaces (API).
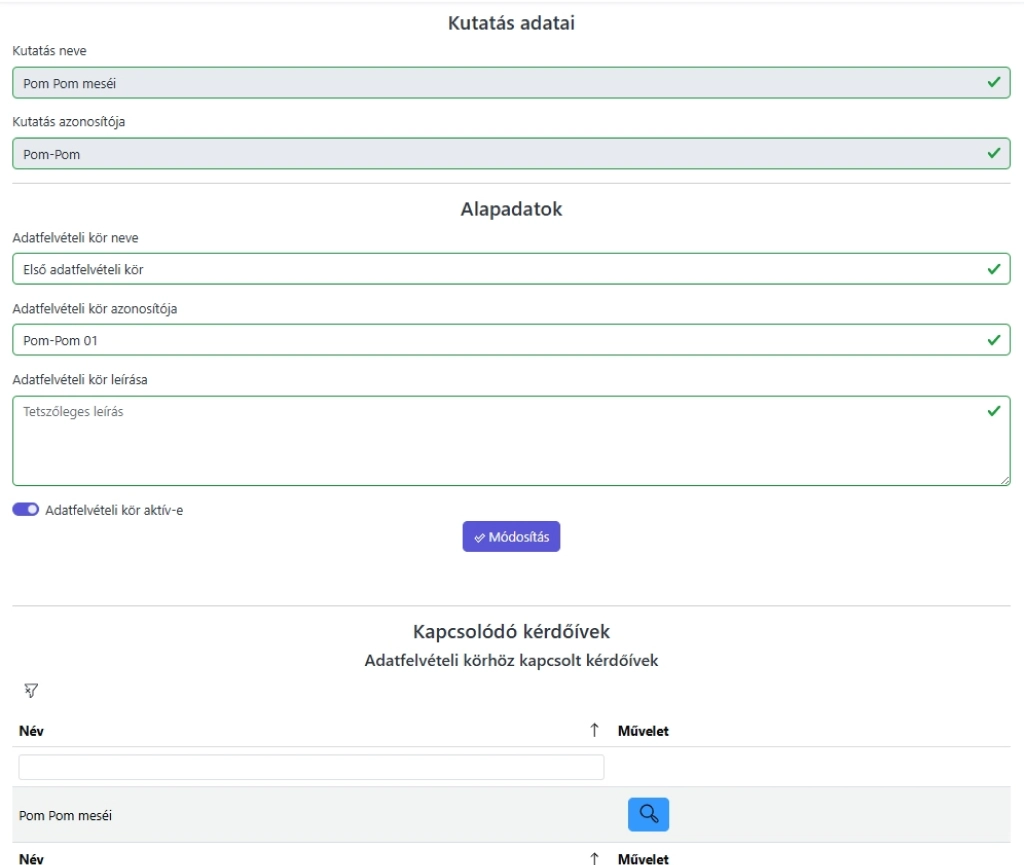
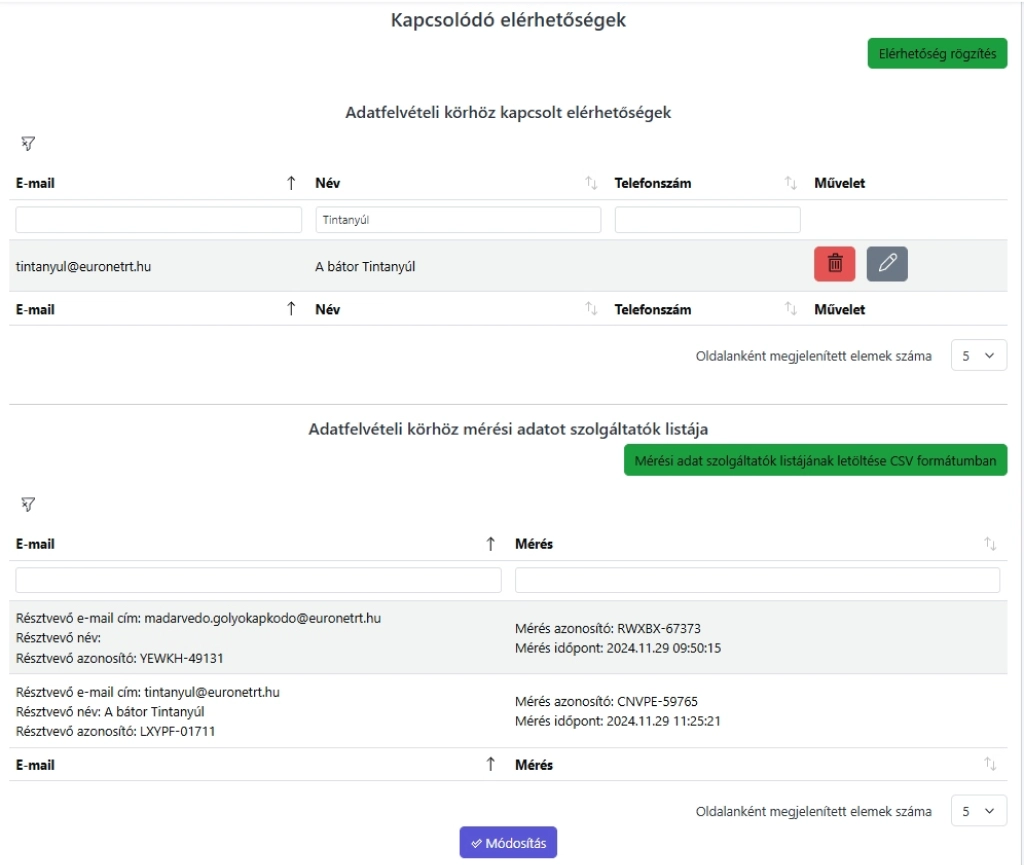
Research Administration and Organizational Module
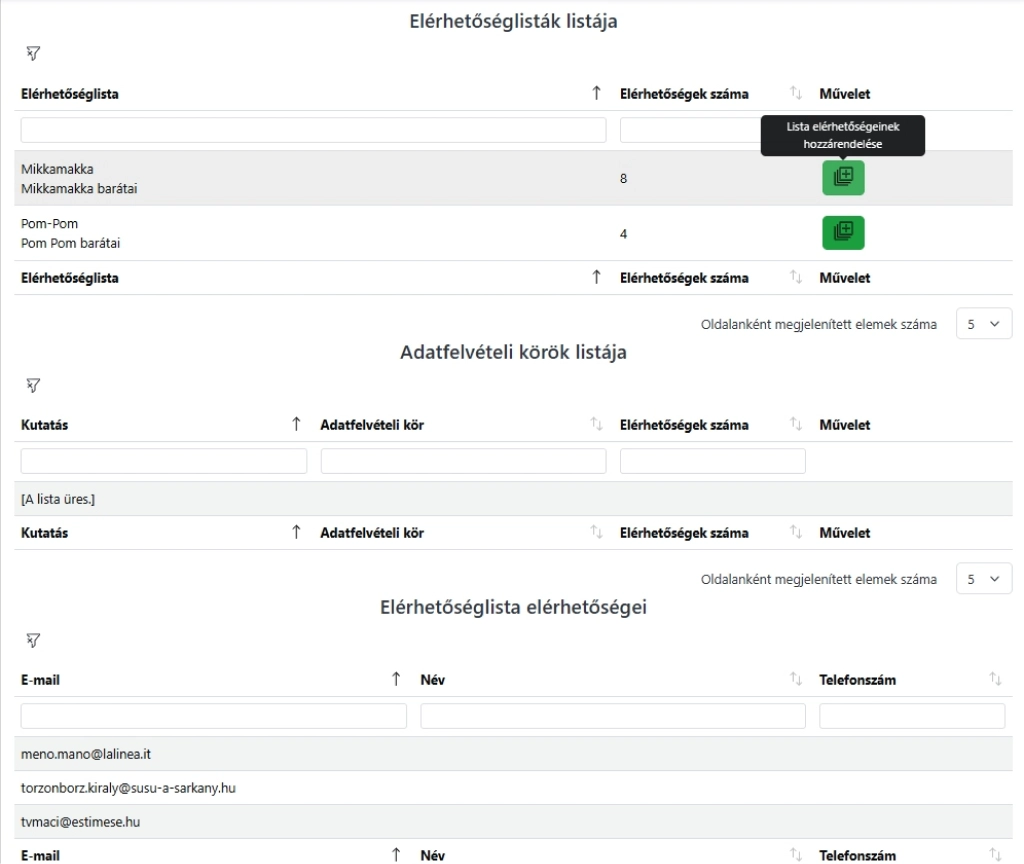
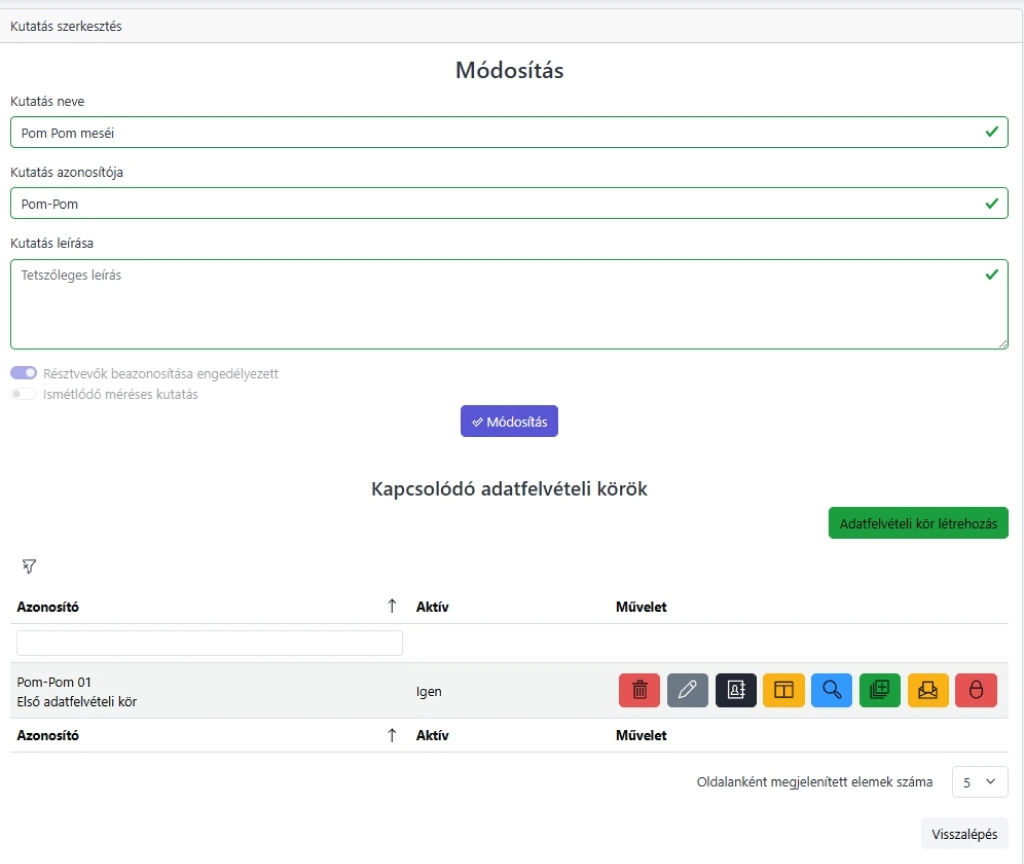
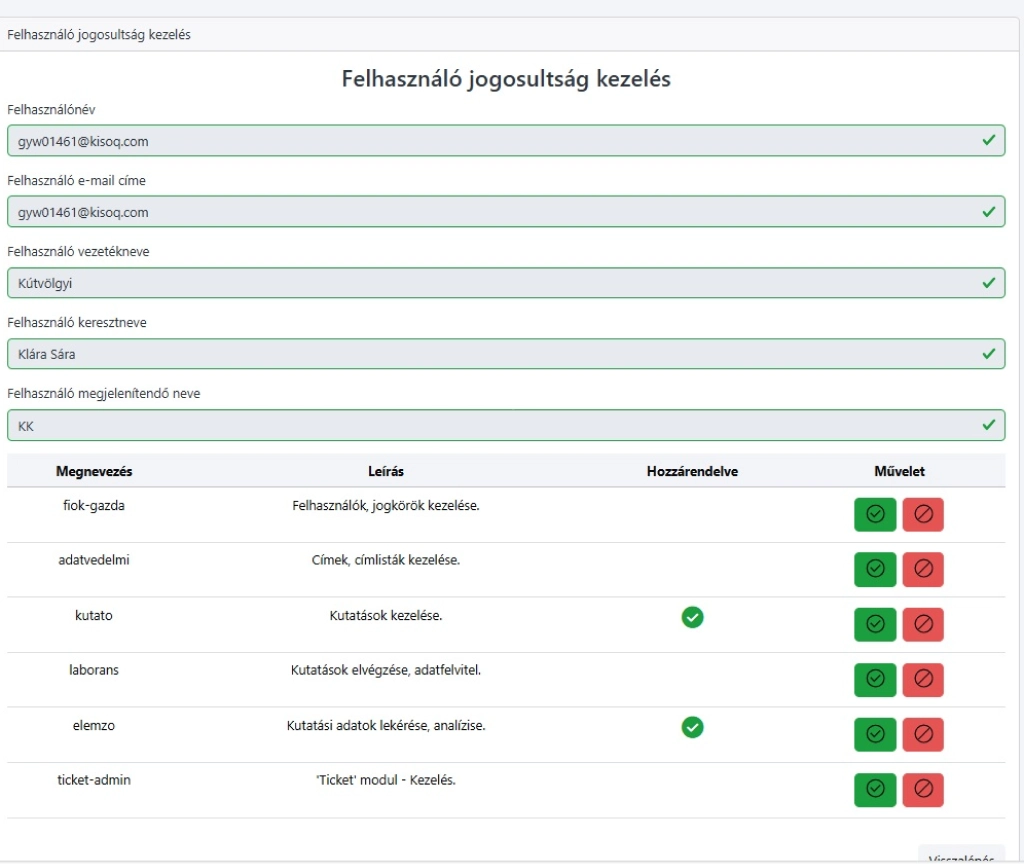
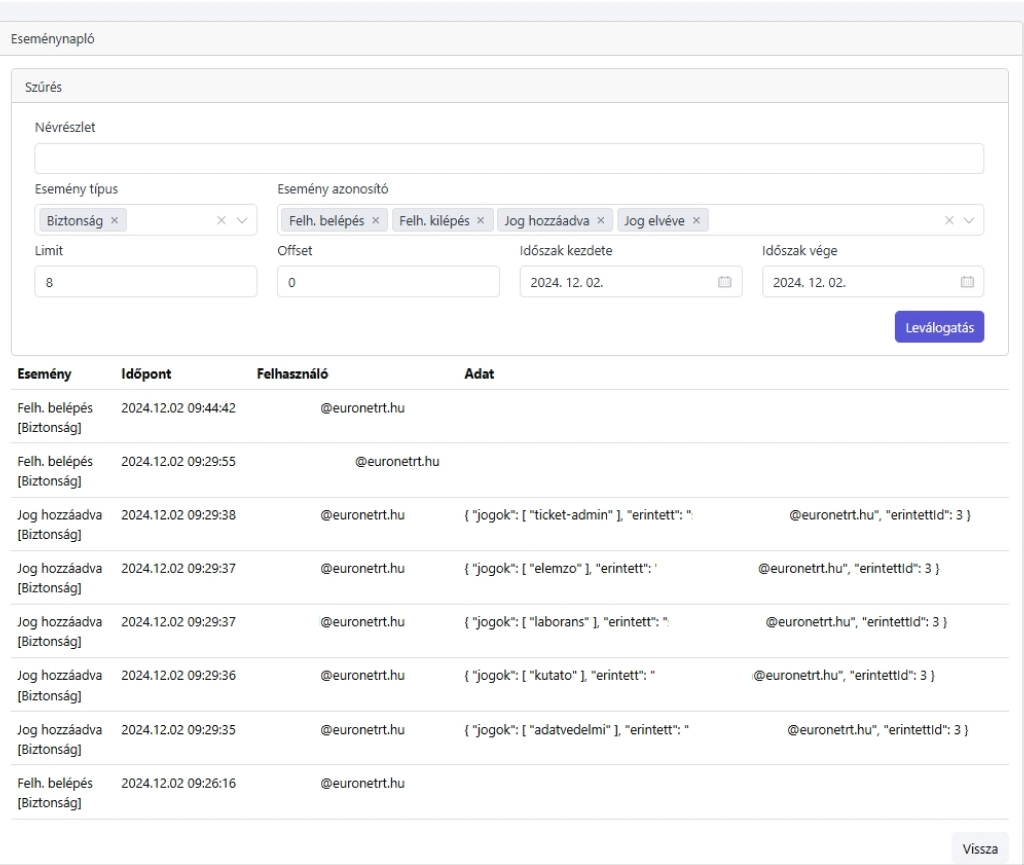
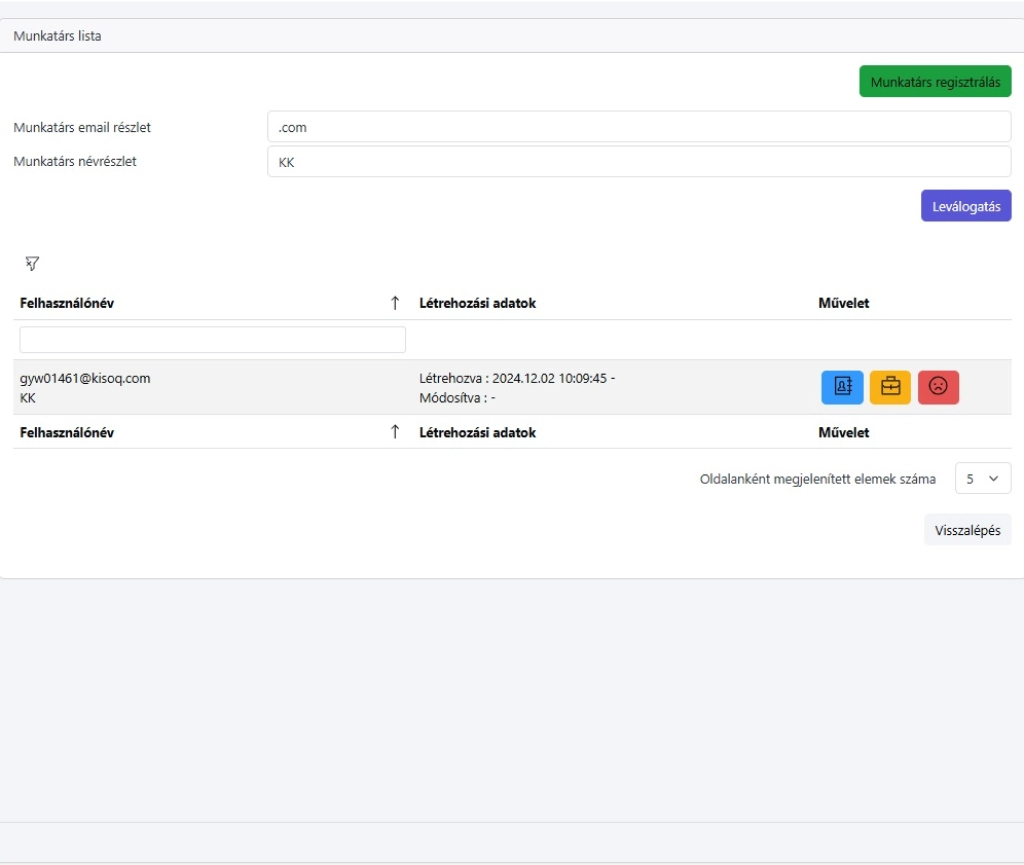
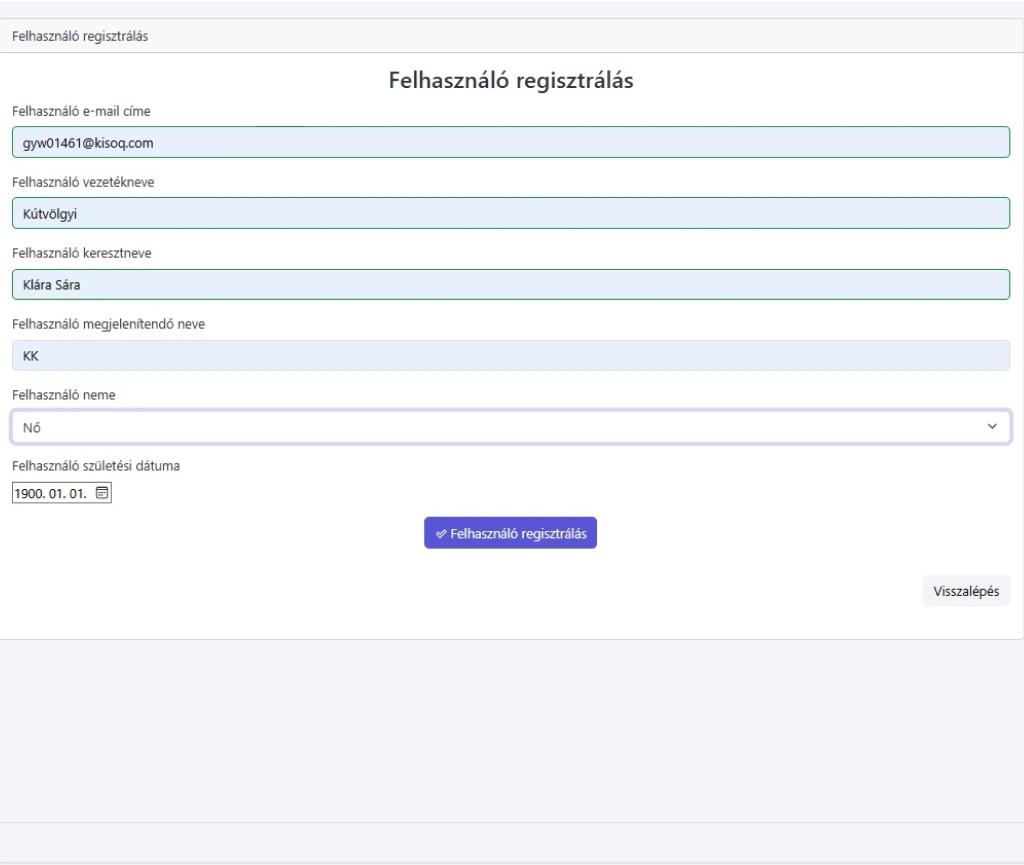
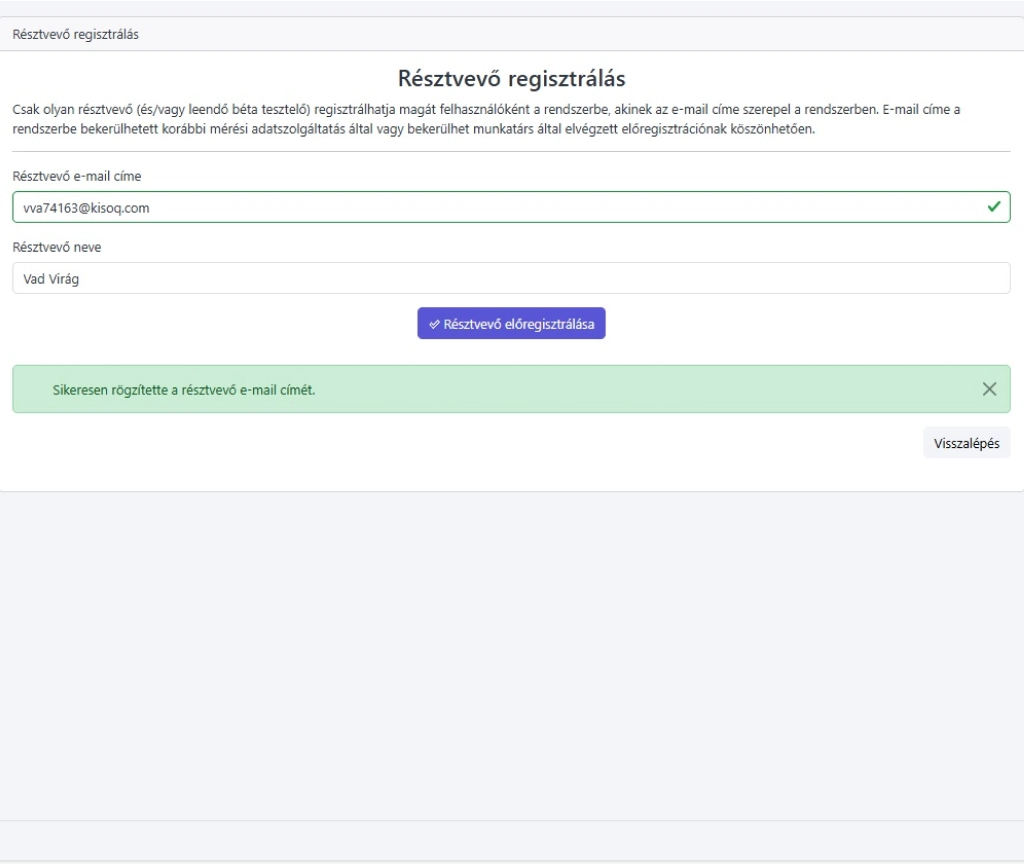
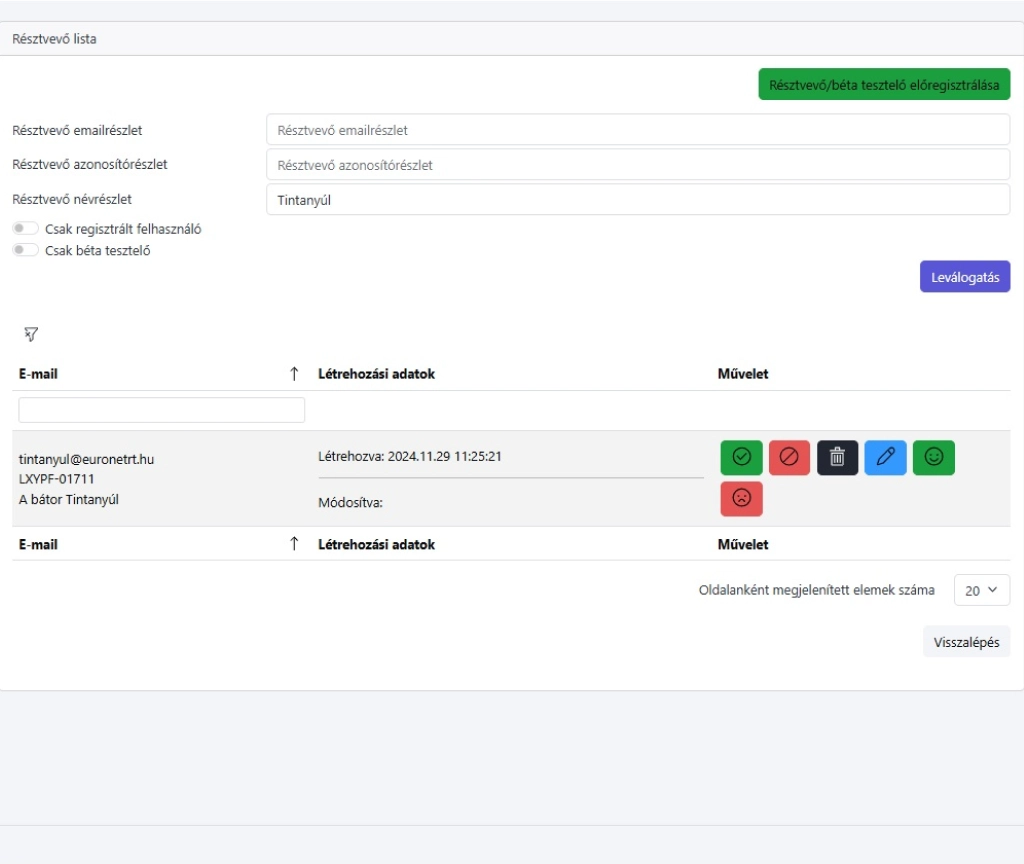
This module handles access, permissions, roles, and email list management.
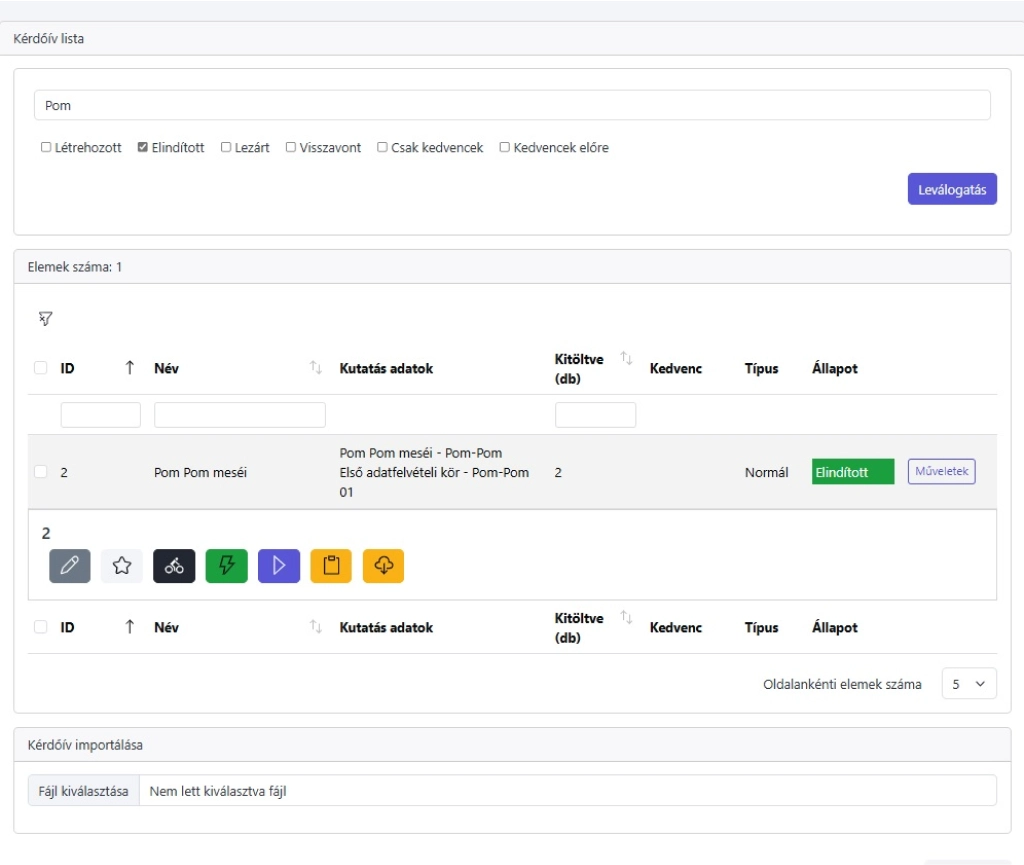
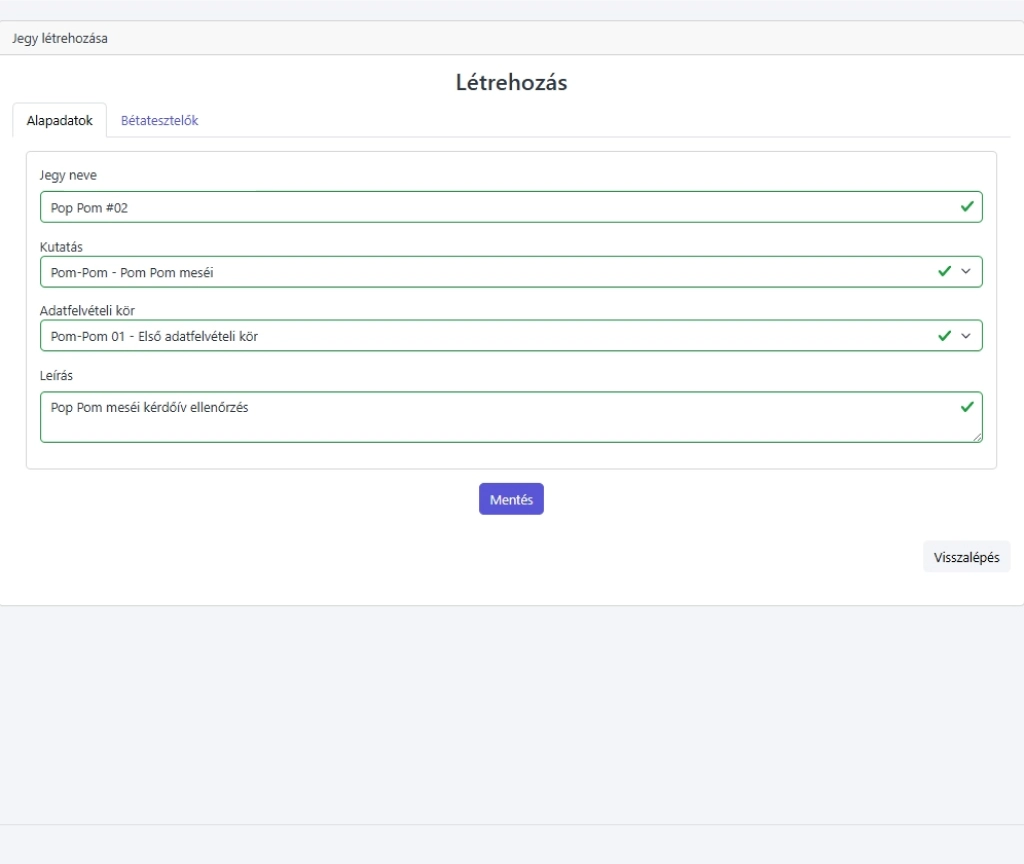
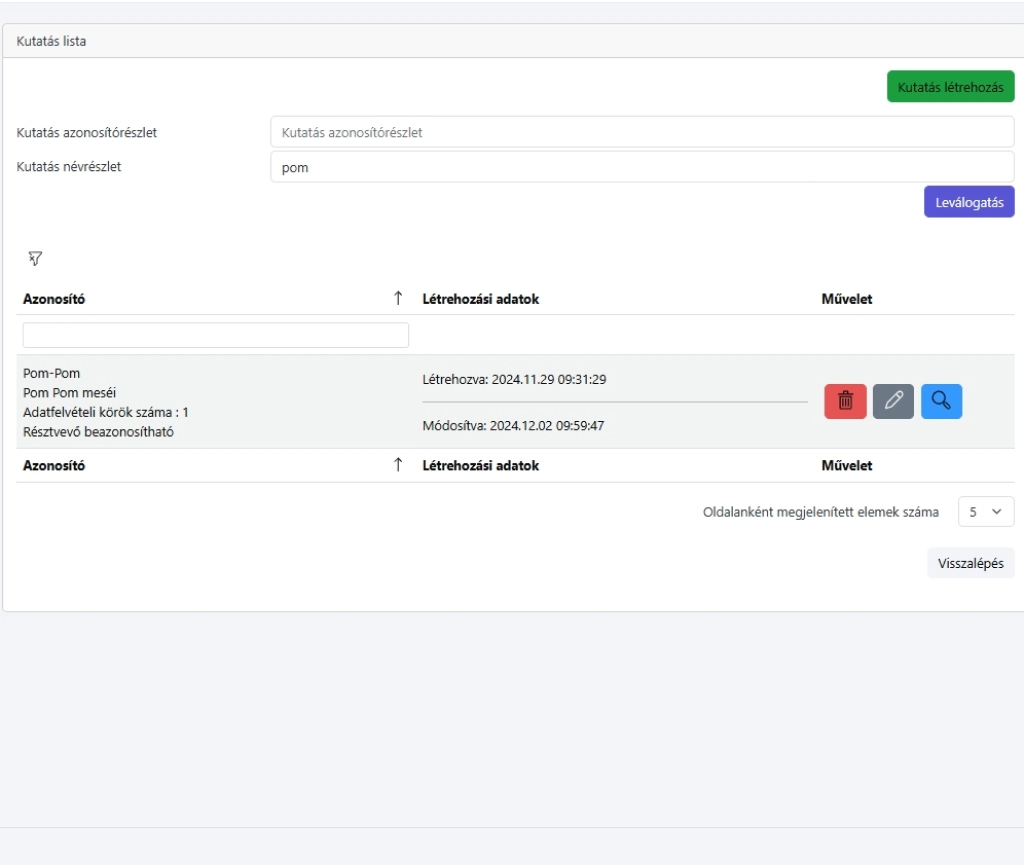
Researchers can create research plans and within them, data collection rounds. This enables subsequent, repeated measurements, with data collection rounds being assigned to pre-invited or on-site participants and questionnaires.
In the system, one owner can manage multiple organizations. All organization data is fully segregated, allowing it to be exported or deleted separately from the system.
VR Module
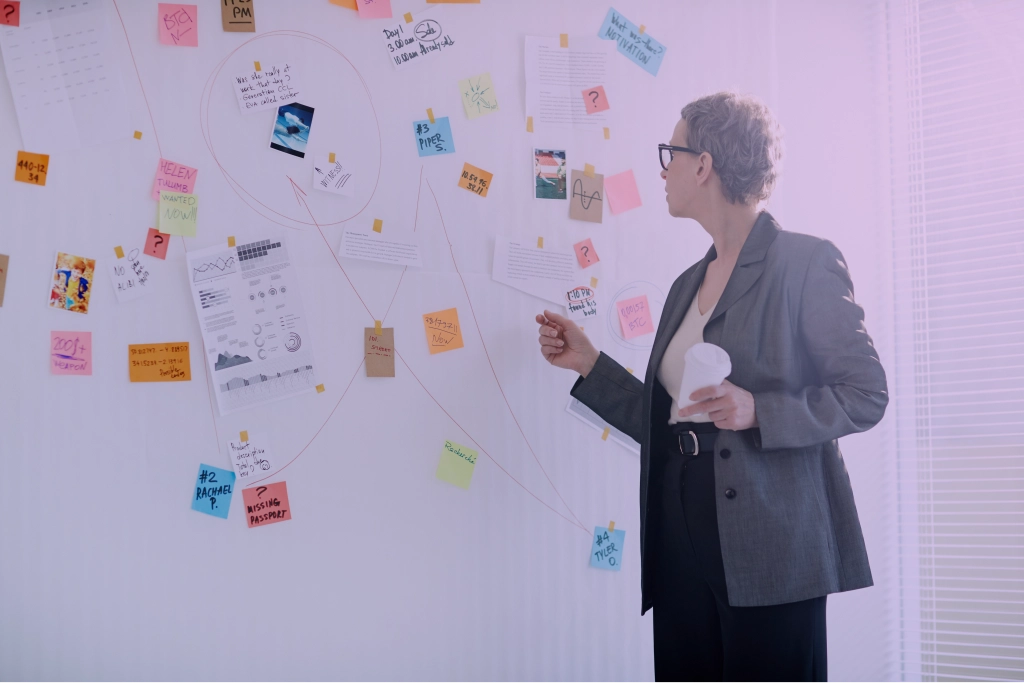
One of the essential elements of the TR4U Platform is the Virtual Reality (VR) module. In this module, existing experiment scenarios can be further developed, transformed, refined, and fine-tuned. The module includes a ready-made track system for testing and calibration purposes, consisting of spectacular video game elements. Skills, memory, and other development tasks are included in the tracks.
Survey Module
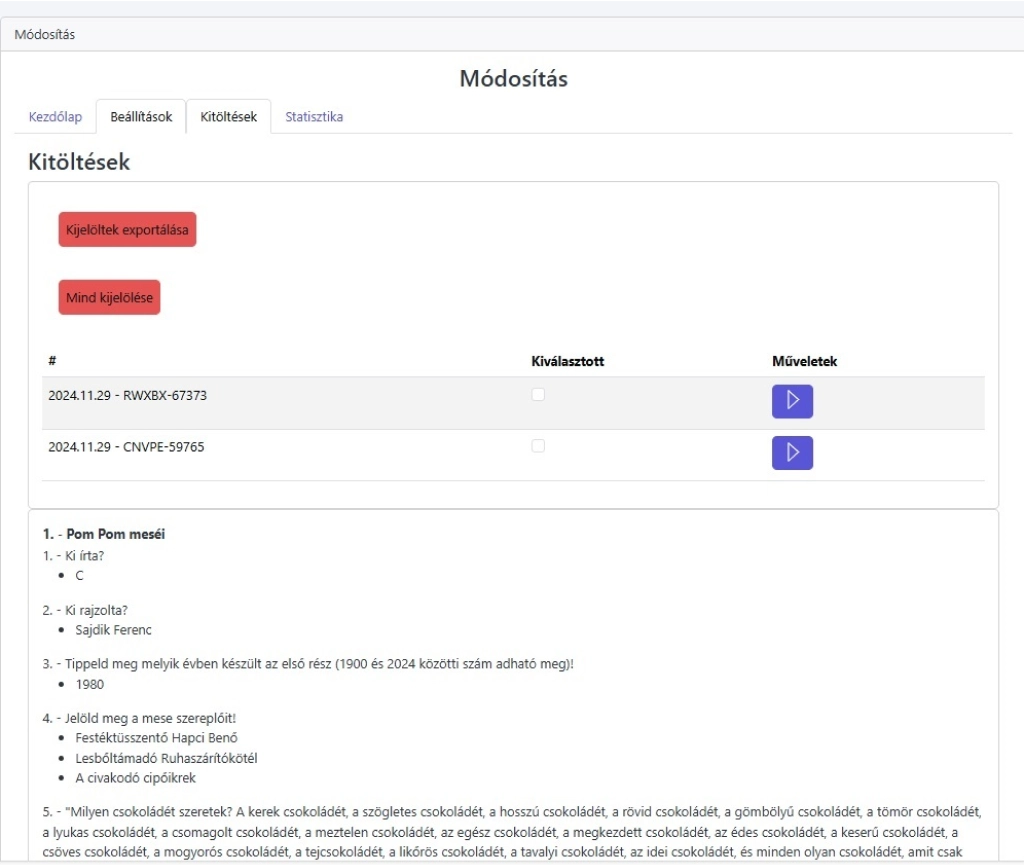
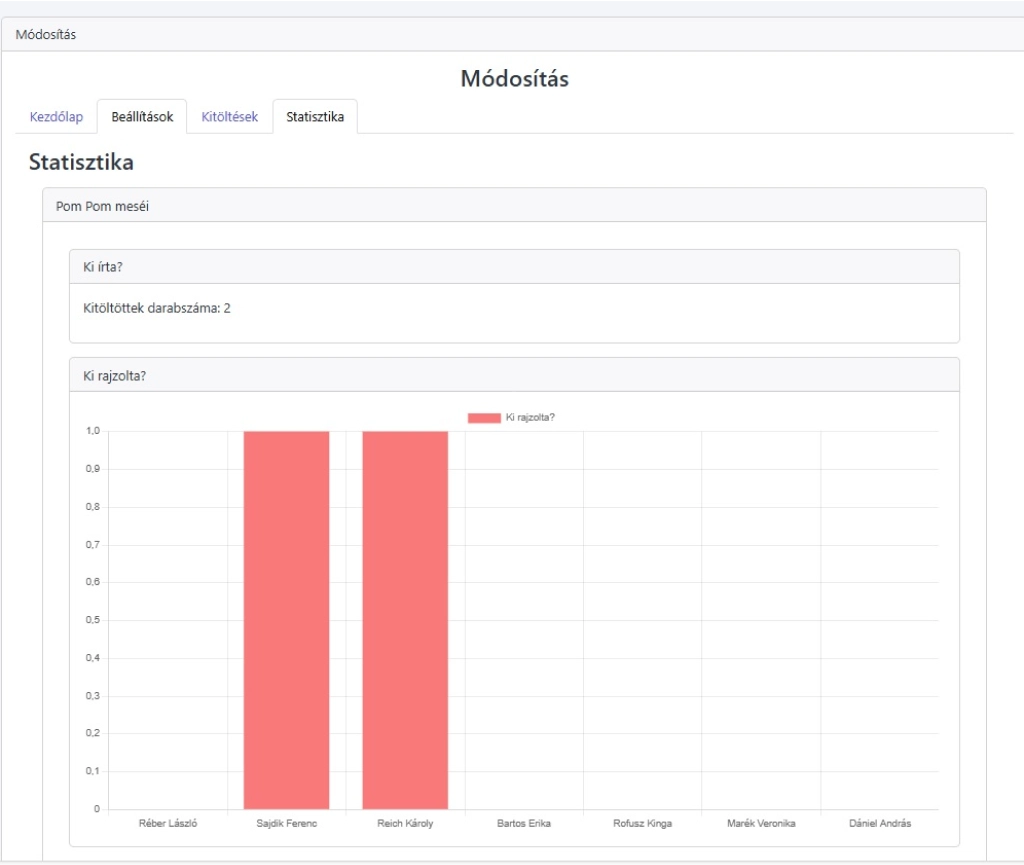
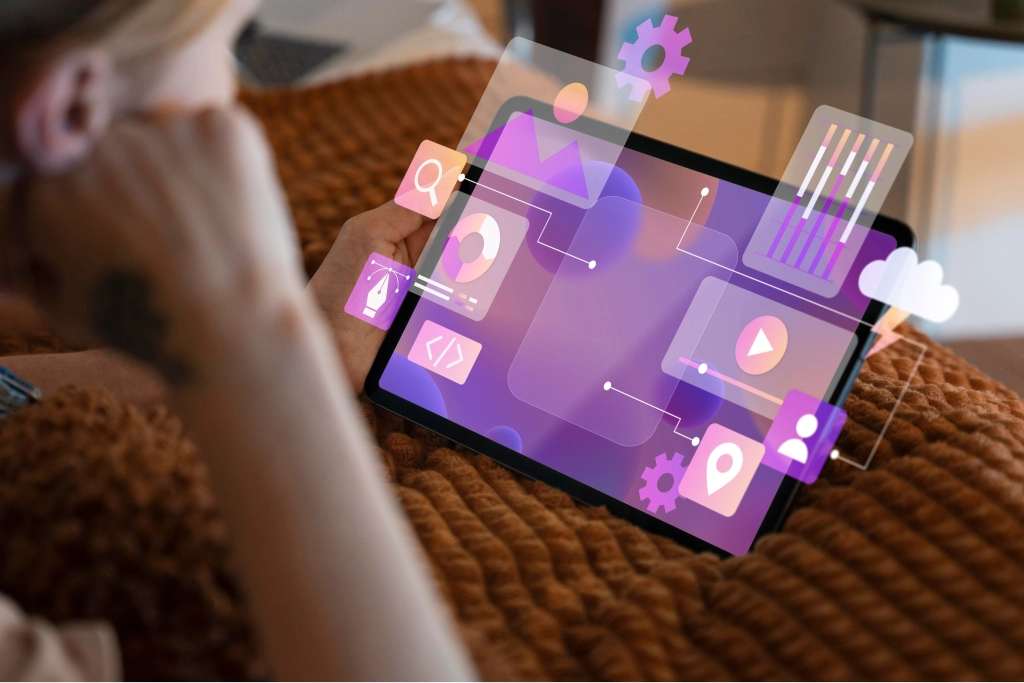
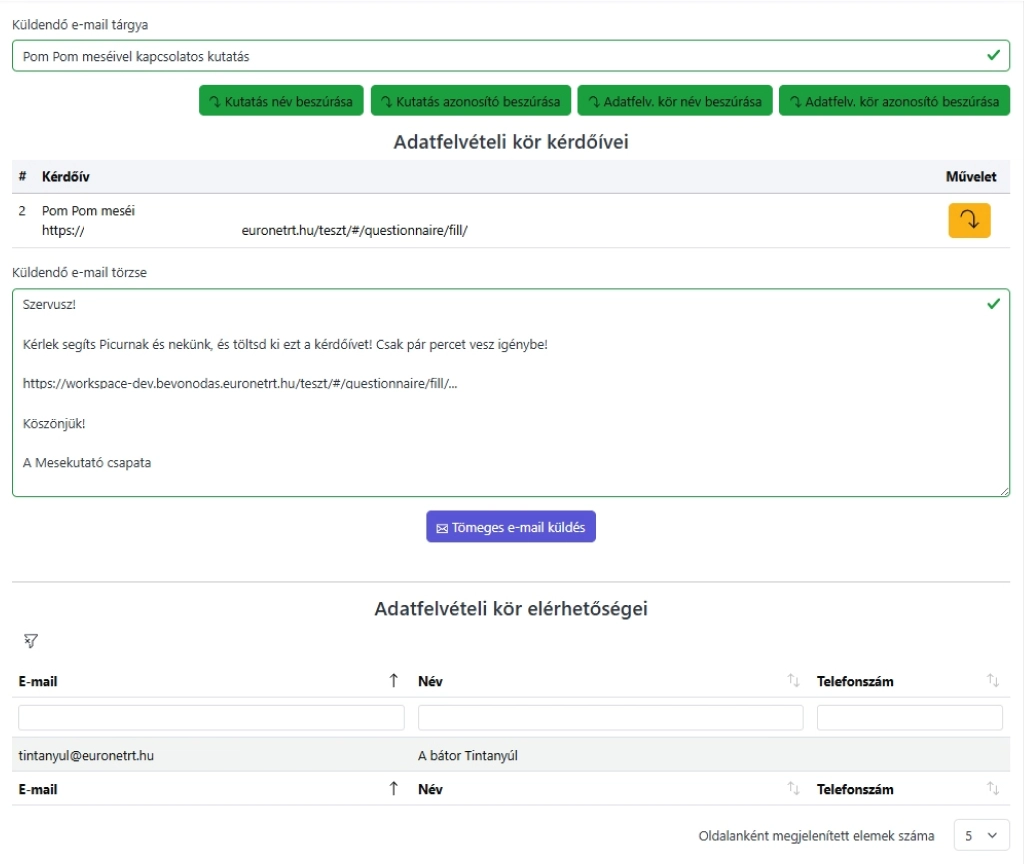
The module can be used for survey data collection. Questionnaires can be composed, the start and end times can be set, along with various other parameters. The advantage is that it is integrated into the system, so data is stored in one place with the research and participant information. The survey module supports data collection outside the lab through the mobile application, allowing for repeated data requests. Questionnaires can also be completed via an automatically sent email link.
Ticketing module
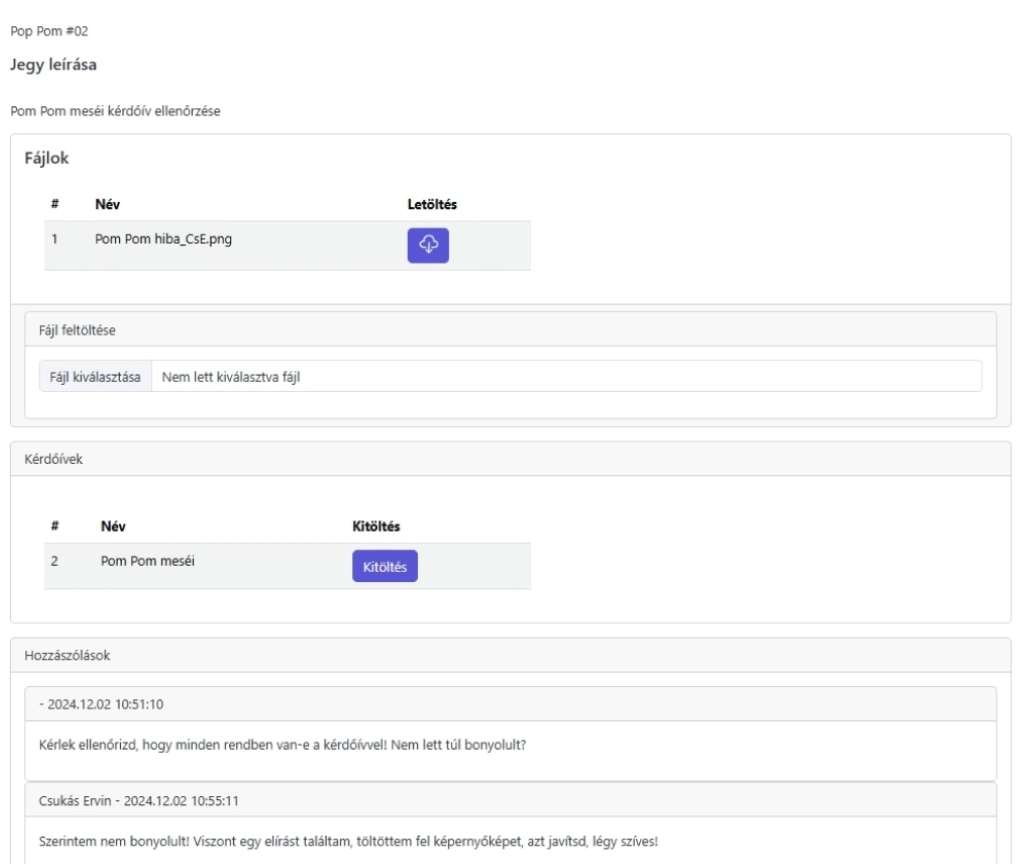
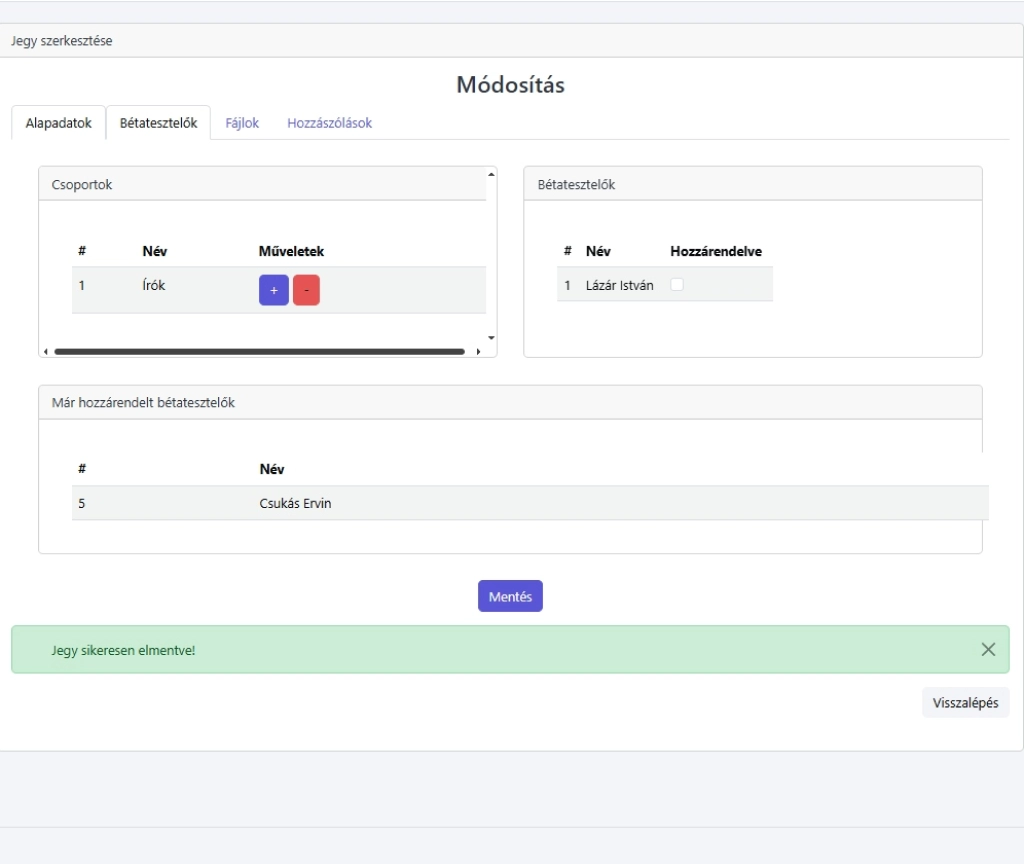
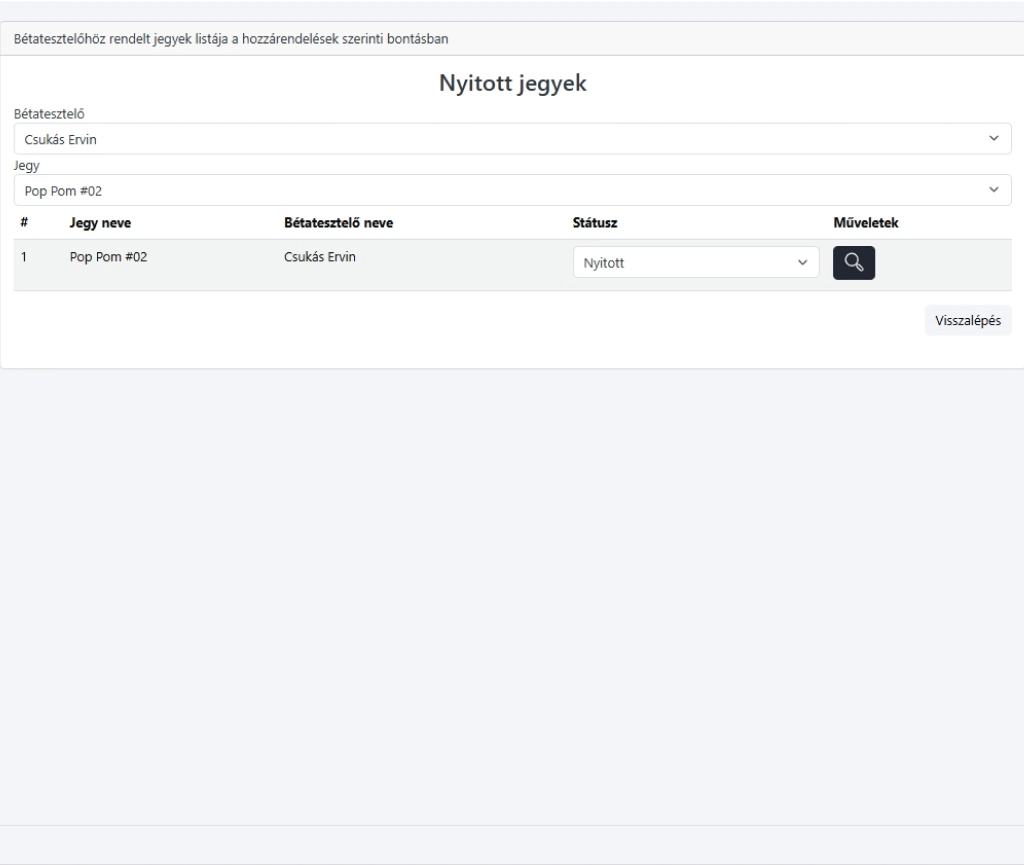
Contributors, such as beta testers, can be invited to any measurement. The contributors or beta testers can be organized into groups. Tickets can be issued to individuals or all members of a group, detailing the tasks they need to perform. The ticket carries the relevant research and data collection context information, so when the tester conducts the measurement, their data is correctly assigned. Importantly, testers can provide feedback on the ticket (comments and files, screenshots), and the ticket owner can also add further comments. This allows the task assigner to give guidance on observed issues, such as found bugs.
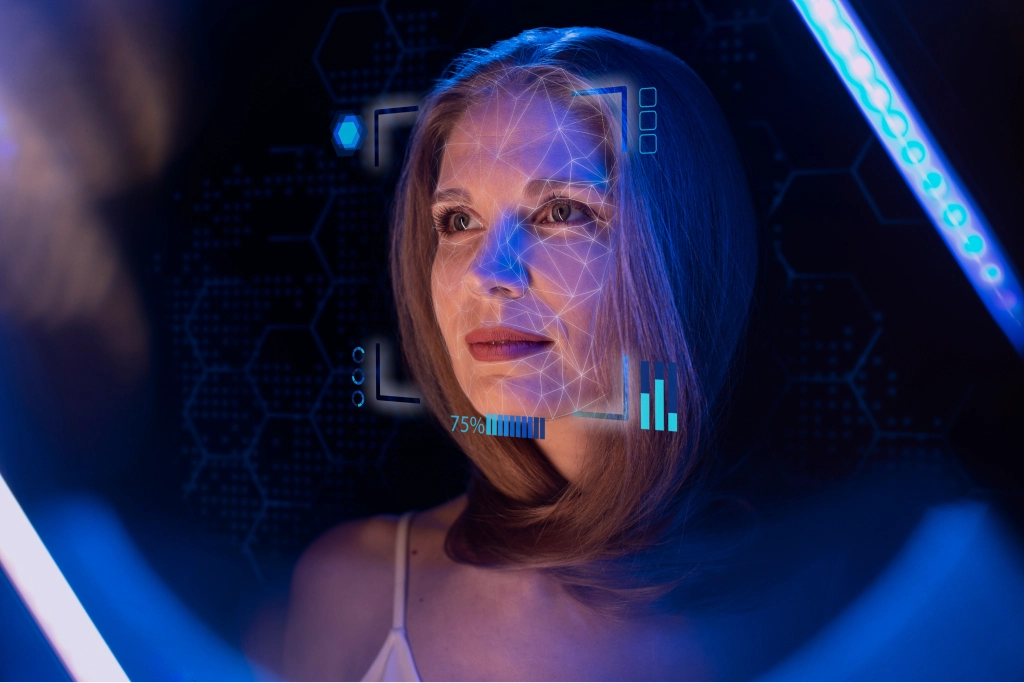
AI emotion analysis module
The software is capable of analyzing videos and audio files. Using AI, it processes a video or audio file, marking it with time-stamped tags indicating where and what emotion was identified. In the case of video, these tags are also displayed on the screen in the resulting video, as well as on the audio track. Similarly, other AI processing methods can be integrated into the system using the same approach.
Playback and Tagging Module
A browser-based data review tool that streams video files. The module displays the data recorded during the measurement on graphs, one below the other. The displayed data and graphs can be easily customized and configured.
Dashboard File and Automated Processing Management Module
The dashboard allows various files to be uploaded to a private cloud drive. The uploaded file can be shared with external parties.
Exporting data from the data space is easy and quick to parameterize and execute here.
The initiated tasks are generally time-consuming, taking minutes or even hours, so the system sends a notification upon completion. The status of ongoing processes can be tracked online. If you have any further questions about formats, please contact our customer service and we will help you select the solution that best suits your needs!
If you have any further questions about the formats, please contact our customer service, and we will help you choose the most suitable solution for you!